Examples

- How to get Paradigm API data into your Googlesheets (option 1)
- How to get Paradigm API data into your Googlesheets (option 2)
Excel
How to get Paradigm API data into your Excel Spreadsheet (option 1)
estimated time to complete: under 3-5 minutes
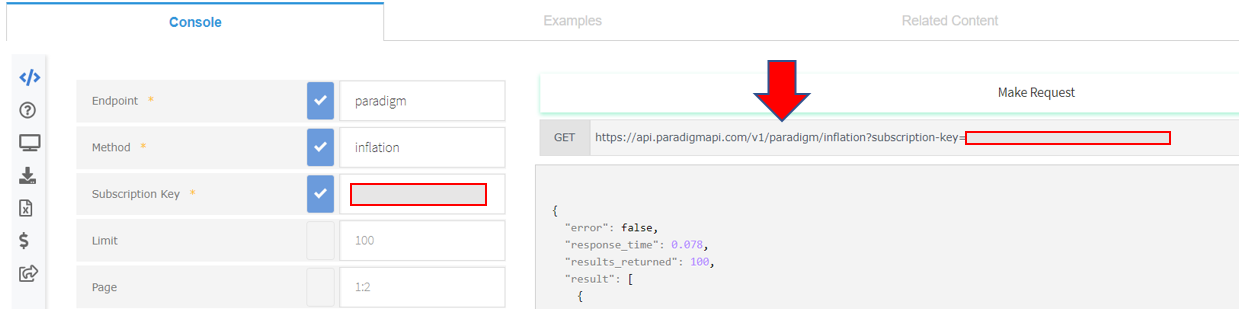
Step 1: Customize your API query string URL using the console
From the desired API console on the https://docs.paradigmapi.com website customize your API call, making sure to populate the required parameters marked by an asterisk, and generate the URL complete with your subscription key. Copy that full string:
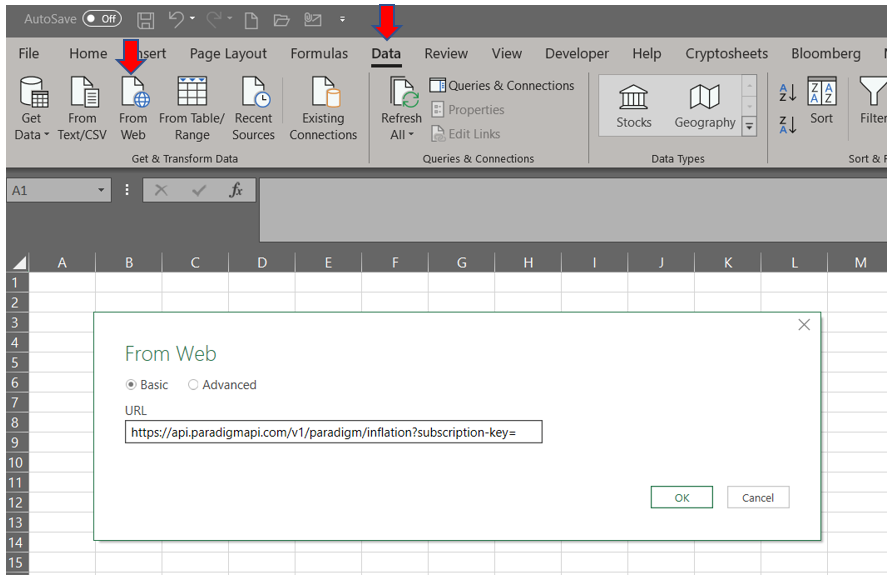
Step 2: Import the data using Excel’s “from web” option
Within an Excel workbook, click on the “Data” tab from the ribbon and within the “Get & Transform” section click on “From Web”. Paste the ParadigmAPI link into the URL box and click OK:
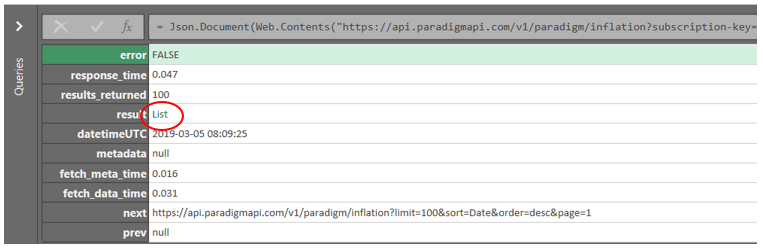
Step 3: Choose and unpack the target data from the API call return
After connecting the Power Query Editor should automatically open. Within the query click the hyperlinked cell containing “List” from the row titled “result”:
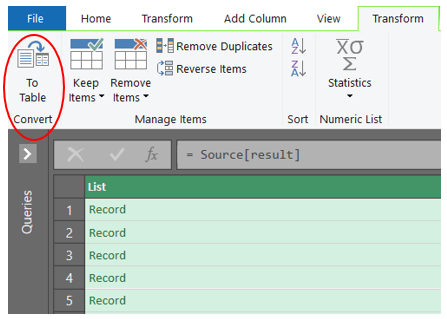
Step 4: Transform the “list” into a table (note: ‘list’ may not be necessary for certain endpoints)
Click the “To Table” button in the upper left-hand corner of the window and then, if need be, select the delimiter needed to further parse columns (most often not required):
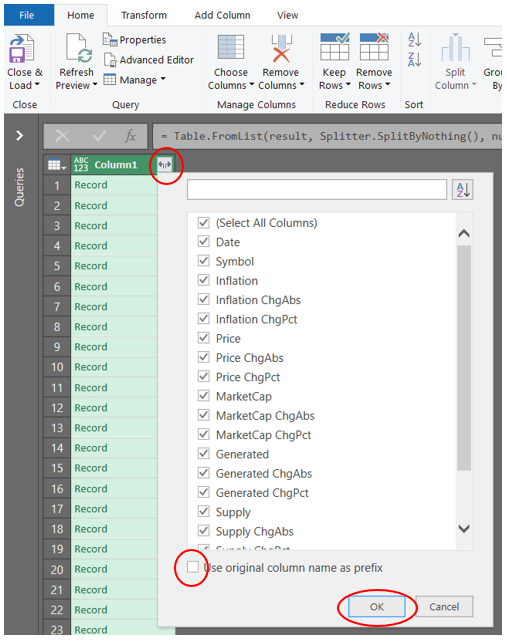
Step 5: Format the table & load it
Expand the columns using the button on the header row and use this step to potentially filter out any undesired columns or add additional sorting for specific columns. Unchecking the “Use original column name as prefix” is recommended but not required, and then click OK.
Step 6: Load the table into your workbook
If the data in your query needs to be reformatted or manipulated further the “Transform” tab has many helpful tools; otherwise click “Close & Load” in the upper left corner of the “Home” and your dataset will render as a table in your spreadsheet.
Googlesheets
How to get Paradigm API data into your Googlesheets (option 1)
estimated time to complete: 2-3 minutes
Step 1: Customize your API query string URL using the console
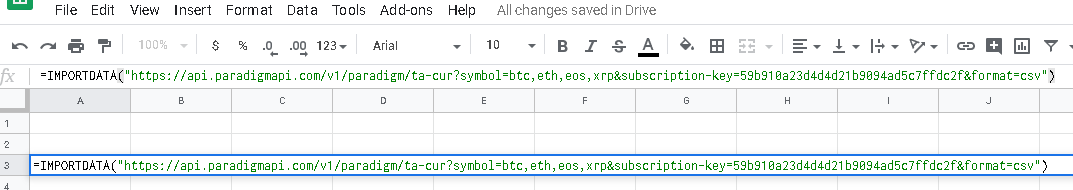
Step 2: Import the data using Googlesheet’s native function =IMPORTDATA()
Using any cell within the sheet type the full string query URL inside the import formula, adding " to each side.
example:
=IMPORTDATA("https://api.paradigmapi.com/v1/paradigm/ta-cur?symbol=btc,eth,xrp,bnb,xtz&subscription-key=INSERTYOURAPIKEY&format=csv")
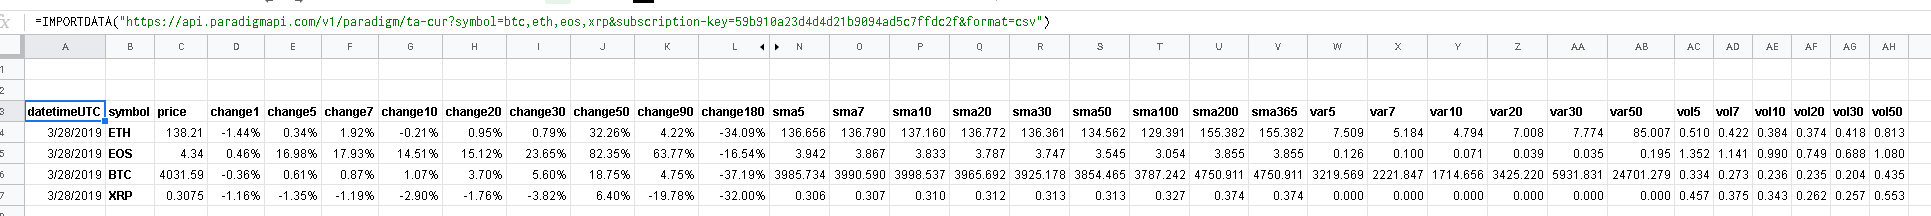
Step 3: Format your data
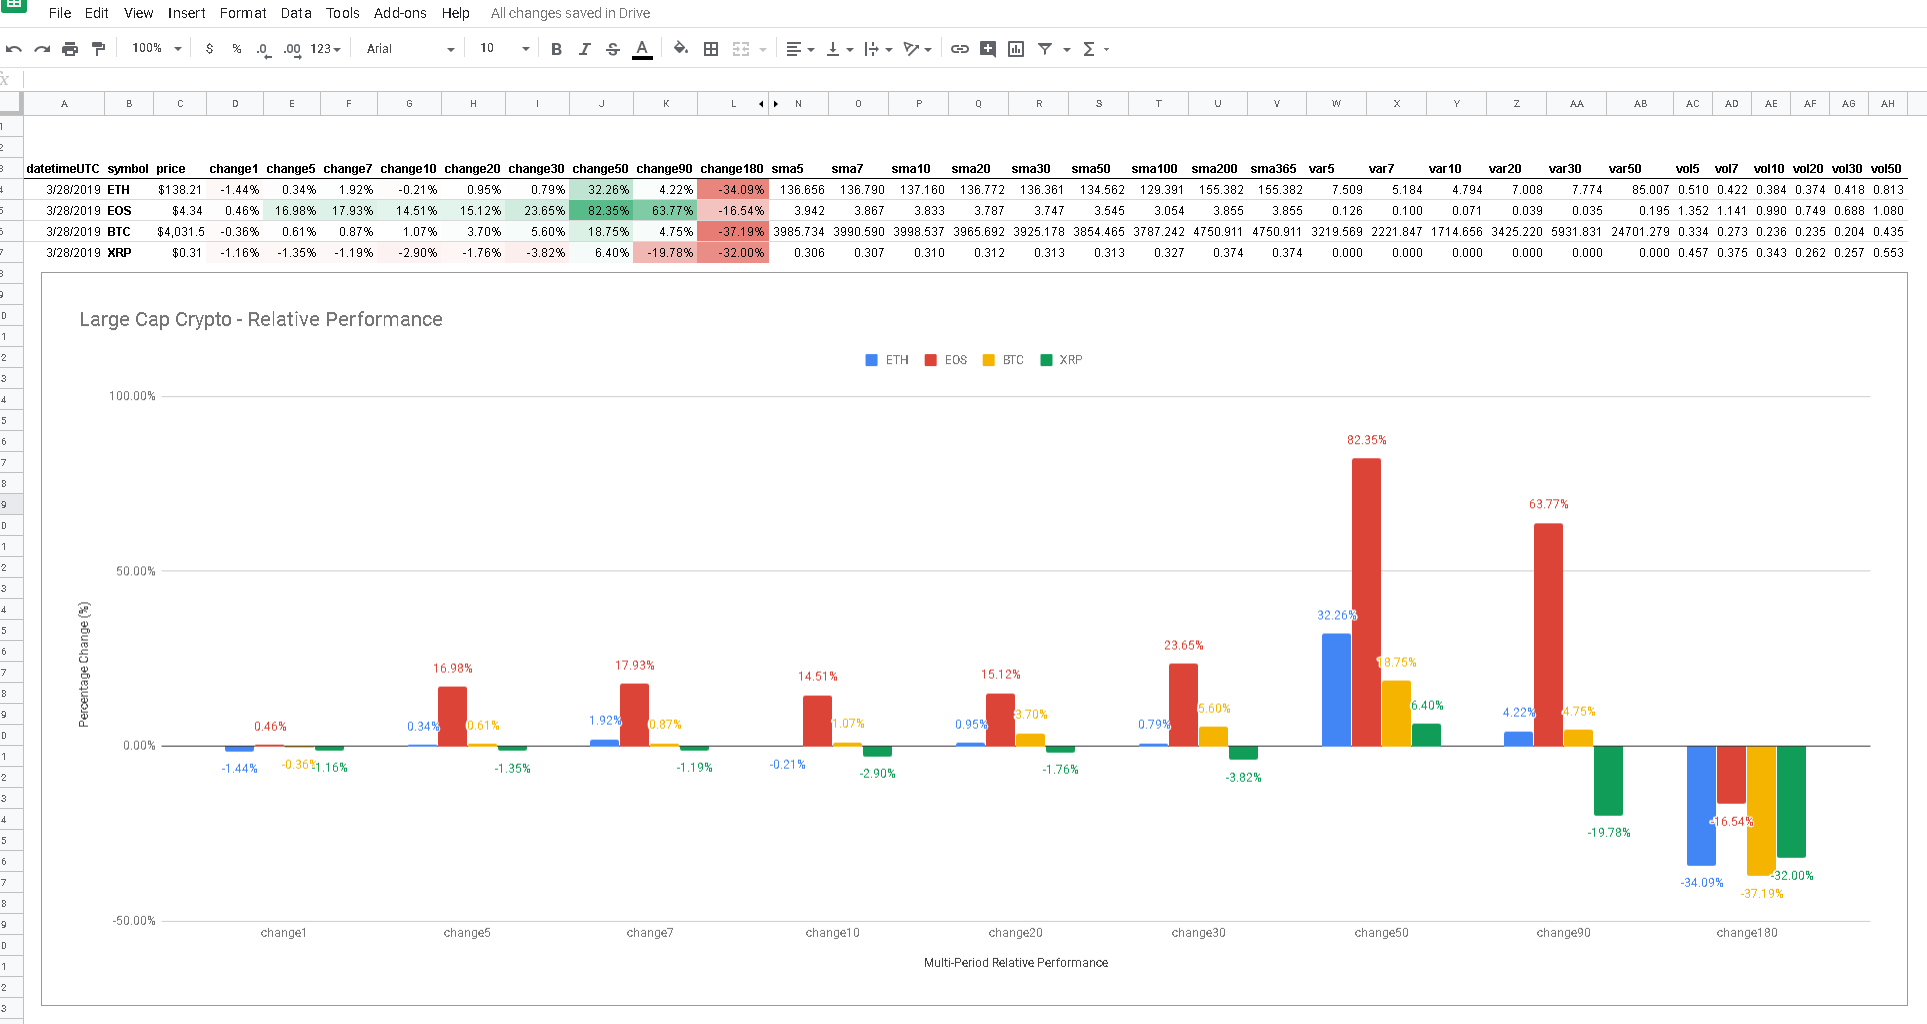
How to get Paradigm API data into your Googlesheets (option 2)
estimated time to complete: under 2 minutes
Step 1: Launch the ParadigmAPI sample Googlesheet
Step 2: Replace the free API key with your own
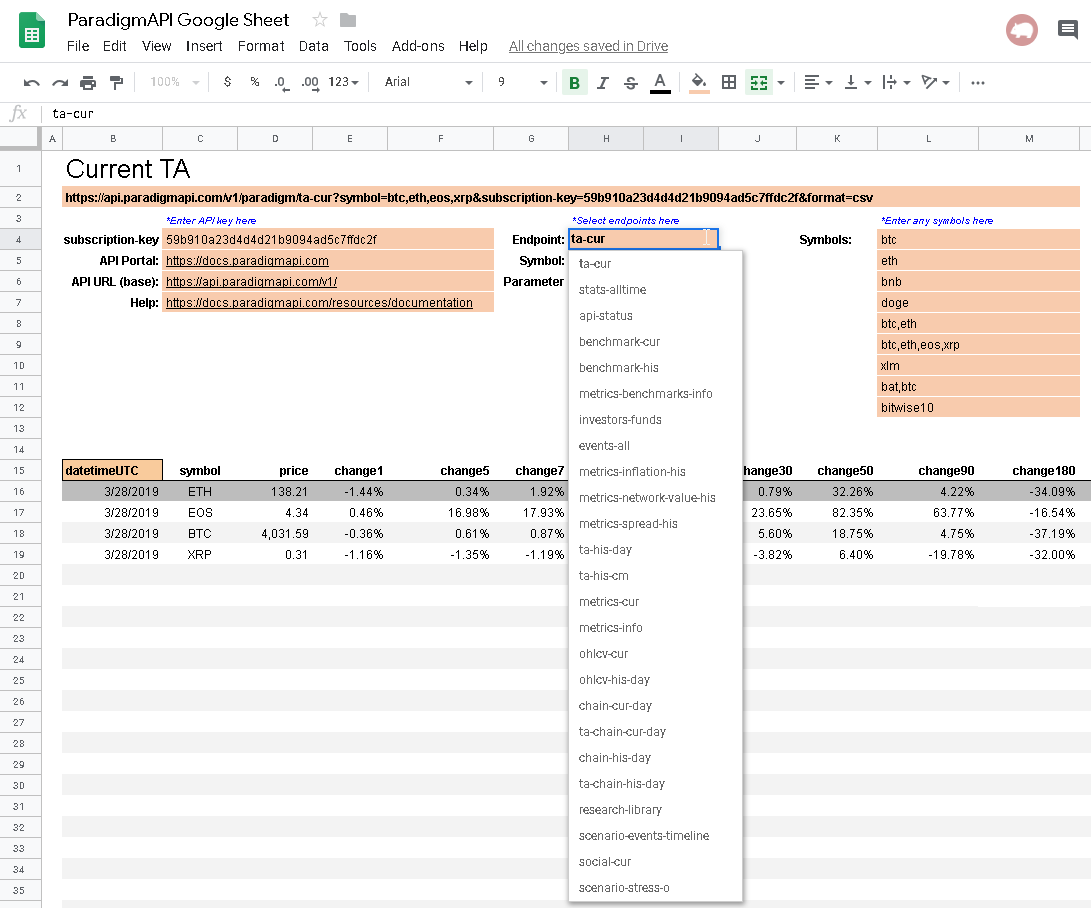
Step 3: Choose an endpoint
Using the built in drop down menu of available endpoints, select which one you want to use
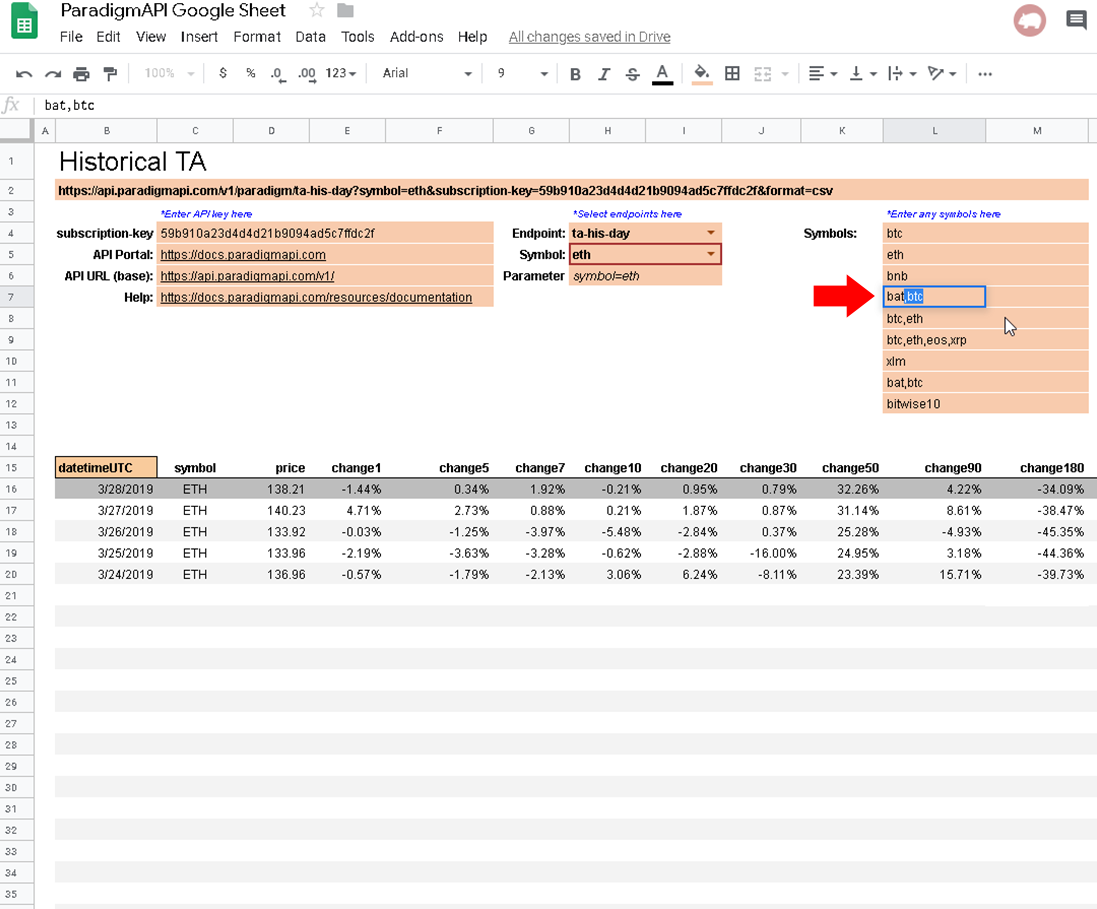
Step 4: Enter in custom symbols
Using the list on the right, enter in custom symbols or combinations of multiple comma separated symbols (note: depending on the endpoint symbols may be custom identifiers, research categories, model scenario types etc)
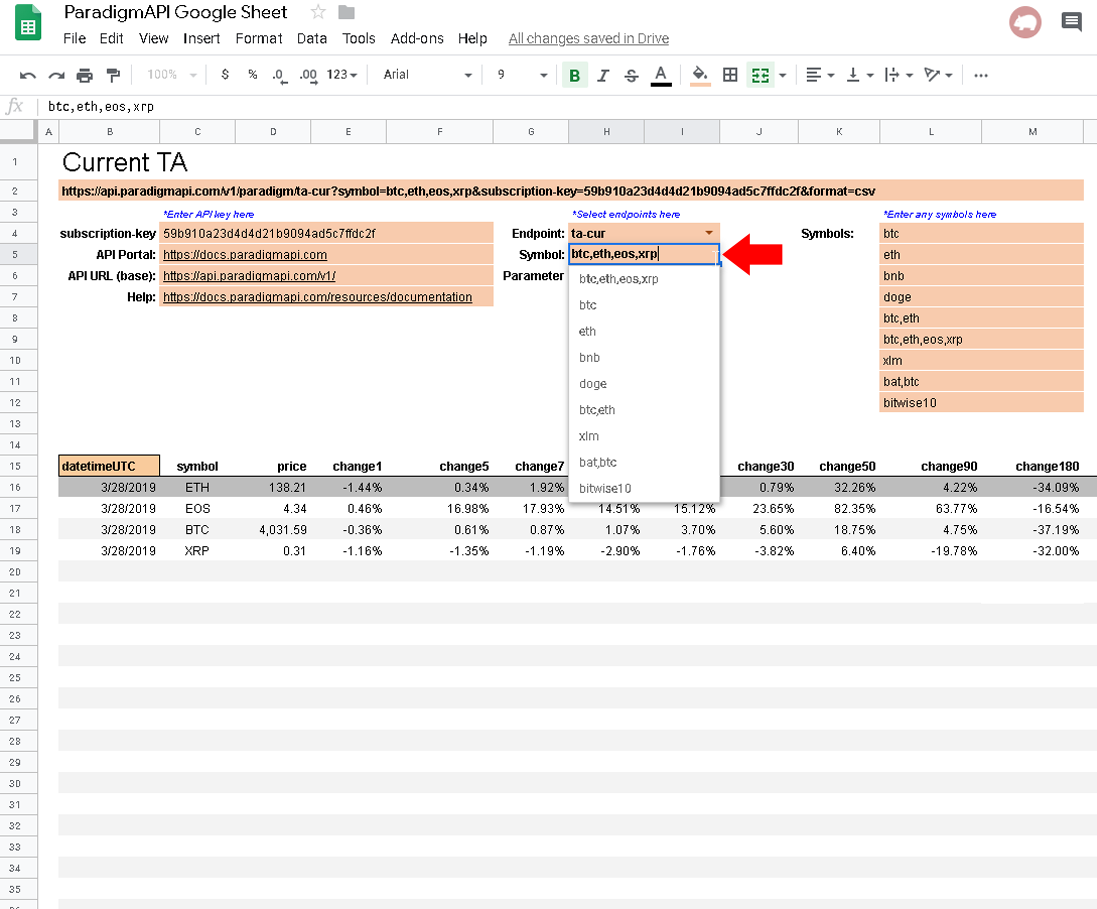
Step 5: Choose from your custom list
Using the built in drop down menu of available custom symbols you created in step 4 above, select which one or combination you want to use, the grid will auto populate with your results (note: depending on the endpoint you may need to reformat or autoformat. You can also clone the sample layout sheet and create multiple versions using different endpoints and customized formats for each)
Plotly
How to get Paradigm API data into your Plot.ly Charts
estimated time to complete: under 2 minutes
Step 1: Customize your API query string URL using the console
From the desired API console on the https://docs.paradigmapi.com website customize your API call, making sure to populate the required parameters marked by an asterisk, and generate the URL complete with your subscription key and the &format=csv parameter.
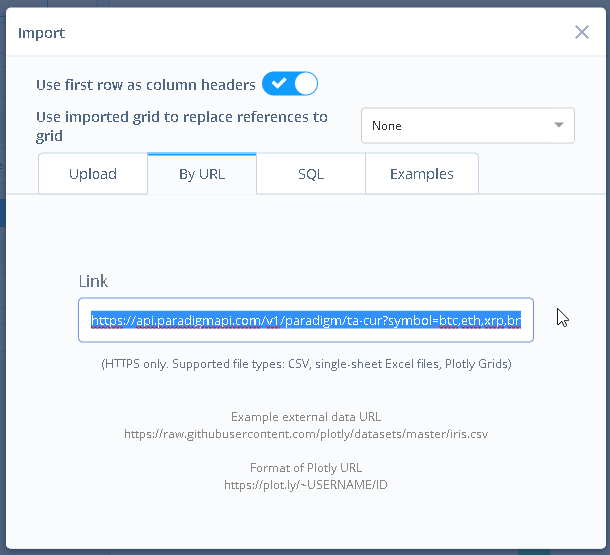
Step 2: Paste the full string URL into the Plot.ly “Import” option using the “By URL” tab
Copy that full string (example): https://api.paradigmapi.com/v1/paradigm/ta-cur?symbol=btc,eth,xrp,bnb,xtz&subscription-key=INSERTYOURAPIKEY&format=csv
Step 3:
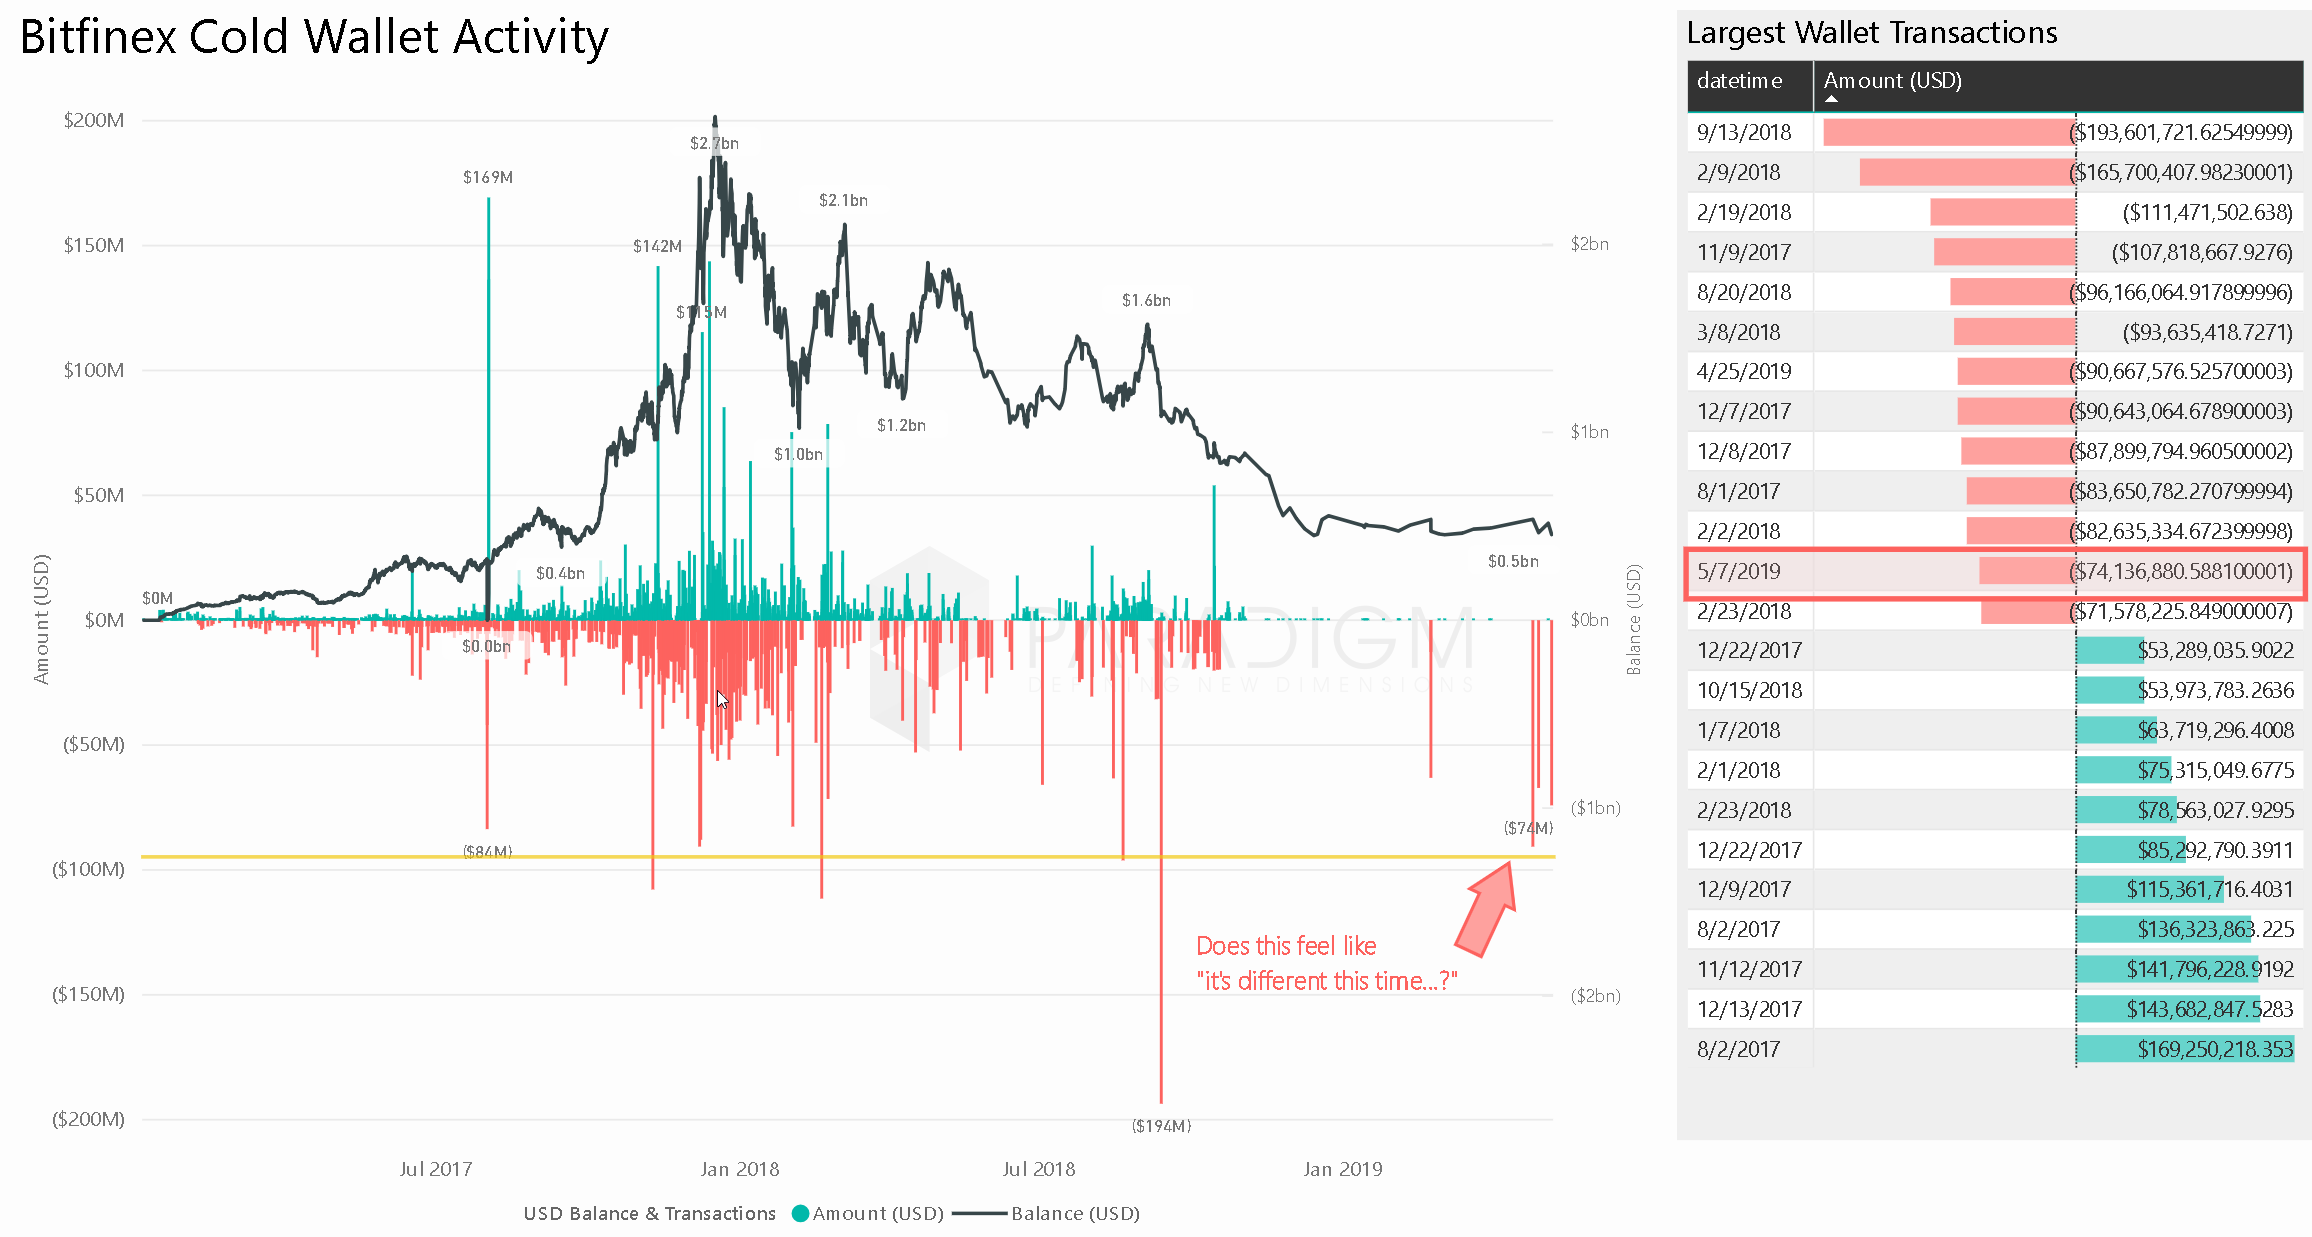
Plot.ly Example 1:
Plot.ly Example 2:
Power BI
How to get Paradigm API data into your Power BI dashboards
estimated time to complete: under 3-5 minutes
Python
How to get Paradigm API data into Python
estimated time to complete: under 3-5 minutes
pandas (only if needed)
Setting Up
To use the library, simply clone this repo (or copy the file) into your working directory. If no API key is specified, the freekey is used.
from paradigmAPI import ParadigmAPI
pAPI = ParadigmAPI()
# or to use your own API key
pAPI = ParadigmAPI('YOUR_API_KEY')
Methods
Currently there are two methods: query and paginate.
Query
paradigmAPI.query is a simple method to query any Paradigm method.
Arguments
- method: The name of the method. All methods are listed on the (documentation)[https://docs.paradigmapi.com]
- args: A dictionary of parameters. All parameters are listed per method on the (documentation)[https://docs.paradigmapi.com]
- df: A boolean value to convert the output to a Pandas DataFrame. If ignored, the function will return a JSON object.
Examples
out = pAPI.query('api-status')
out = pAPI.query('his-ohlcv-day', {'symbol': 'BTC'})
Paginate
paradigmAPI.paginate is a simple method to paginate through any historical Paradigm method. Examples include ta-his-day, ohlcv-his-day.
Note: Be careful with the pagination window. If the number of requests exceeds your current quota, the data will not be returned.
Arguments
- method: The name of the method. All methods are listed on the (documentation)[https://docs.paradigmapi.com]
- start: The start date of the pagination. Format is
YYYY-mm-dd(2019-01-01) - end: The end date of the pagination. Format is
YYYY-mm-dd(2019-01-01) - args: A dictionary of parameters. All parameters are listed per method on the (documentation)[https://docs.paradigmapi.com]
- df: A boolean value to convert the output to a Pandas DataFrame. If ignored, the function will return a JSON object.
Examples
out = pAPI.paginate('his-ohlcv-day', '2018-01-01', '2019-01-01', {'symbol': 'BTC'})
© ParadigmAPI.com 2019-20 | All Rights Reserved | info@paradigmapi.com.