Help Center
Table of Contents
1. Getting Started (look here)
- Login
- Signing Up
- Generate API keys
- How to use
2. API Portal (look here)
Navigation
- Login
- Signing Up
- Generate API keys
- How to use
Guides
Tutorials
Examples
Here you can find sample templates and code examples written in different languages to help you quickly get started.3. API Integration (look here)
Errors & error codes
- Please see our detailed coumentation about various API responses including error codes here
4. Other (look here)
5. Feature Request (look here)
6. Billing (look here)
7. Customer Support (look here)
If none of your issues were listed above, please don’t hesitate to contact us support@paradigmapi.com
Getting Started
- Welcome! have a look around the site or start with
the explorerto inspire your objective here. - Generate an
API keyby signing up here - Check our
quick guideshere - Review our official
API documentationhere. - Check the
status pagehere to make sure your endpoints are online and not temporarily down for maintenance
API Portal
Learning to effectively navigate the portal is an important part of using the Paradigm API. We chose to design and build our portal differently then most others so we could easily integrate rich and dynamic content. This allows anybody from a first time visitor to a professional power user to hit the site at anytime, make live requests and instantly recieve visual feedback and tangible data in seconds.
Guides
Tip: Use the quick guides as a handy visual reference for our primary user interfaces
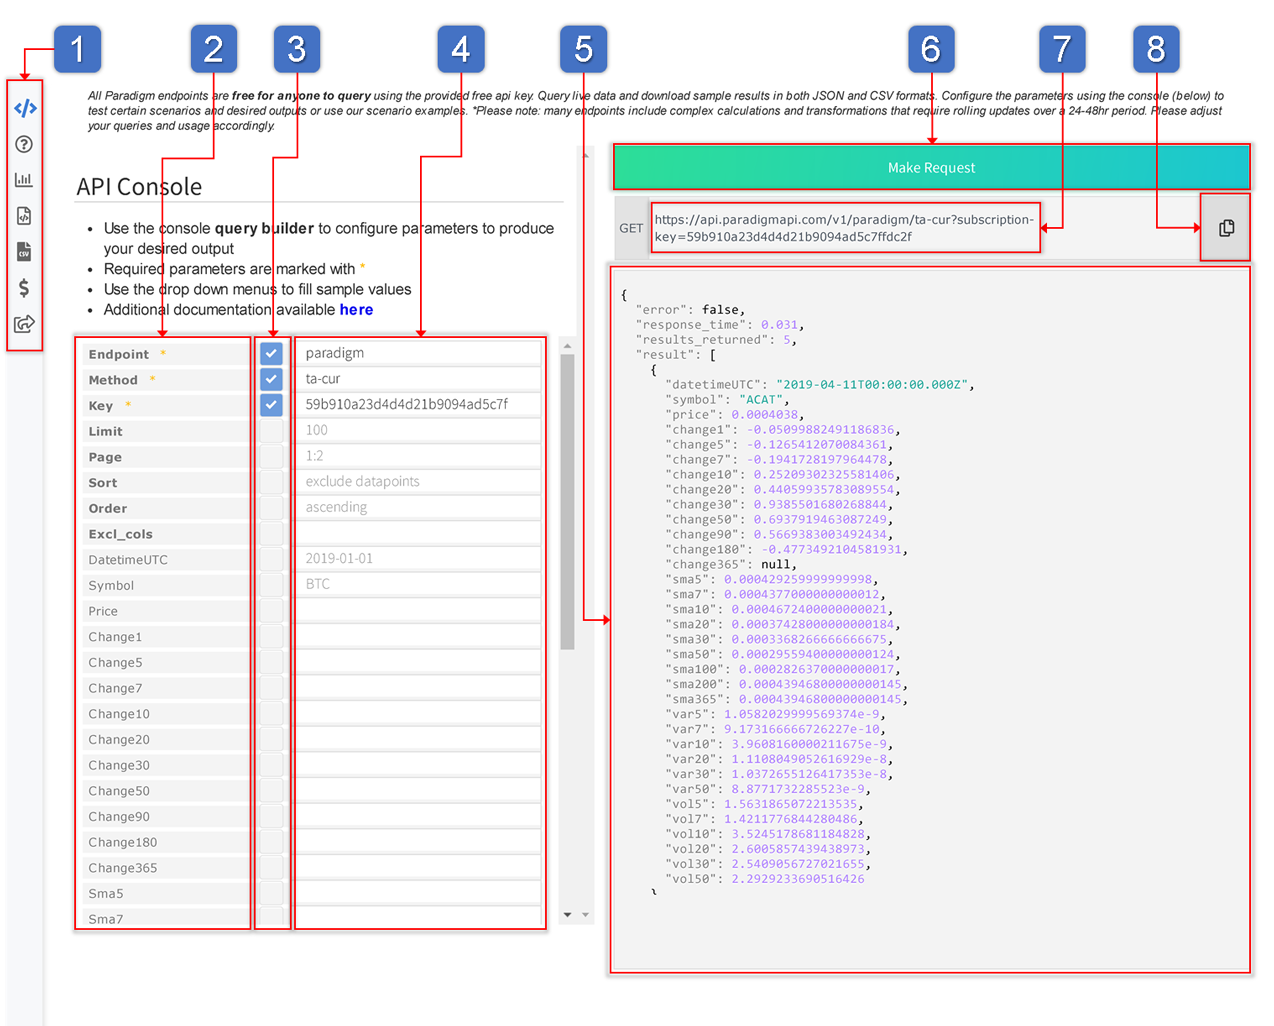
API Console
Purpose: Use the query builder to create and test your queries against live data for Paradigm endpoints
Overview: The query builder is one of the most powerful tools the Paradigm console has to offer. It provides extensive flexibility and configurability to test, stretch, bend and break your target query against the data. Pre-served parameter values (useable from the drop down menus) make it easy to get a working query executed on your first try.
Features:
- Configure limitless combinations of queries using parameters, operators, and filters
- Toggle individual parameters on/off without having to retype them over and over
- Try our example
scenariosandclusters- Export your query data right from the console real time in
CSV,JSONor intoCryptoSheets for Excel or Googlesheets
Console Control Surface
- Left nav bar
- Parameters
- Parameter toggles
- Parameter inputs
- Response container
- Make request
- Method query string
- Copy method query string
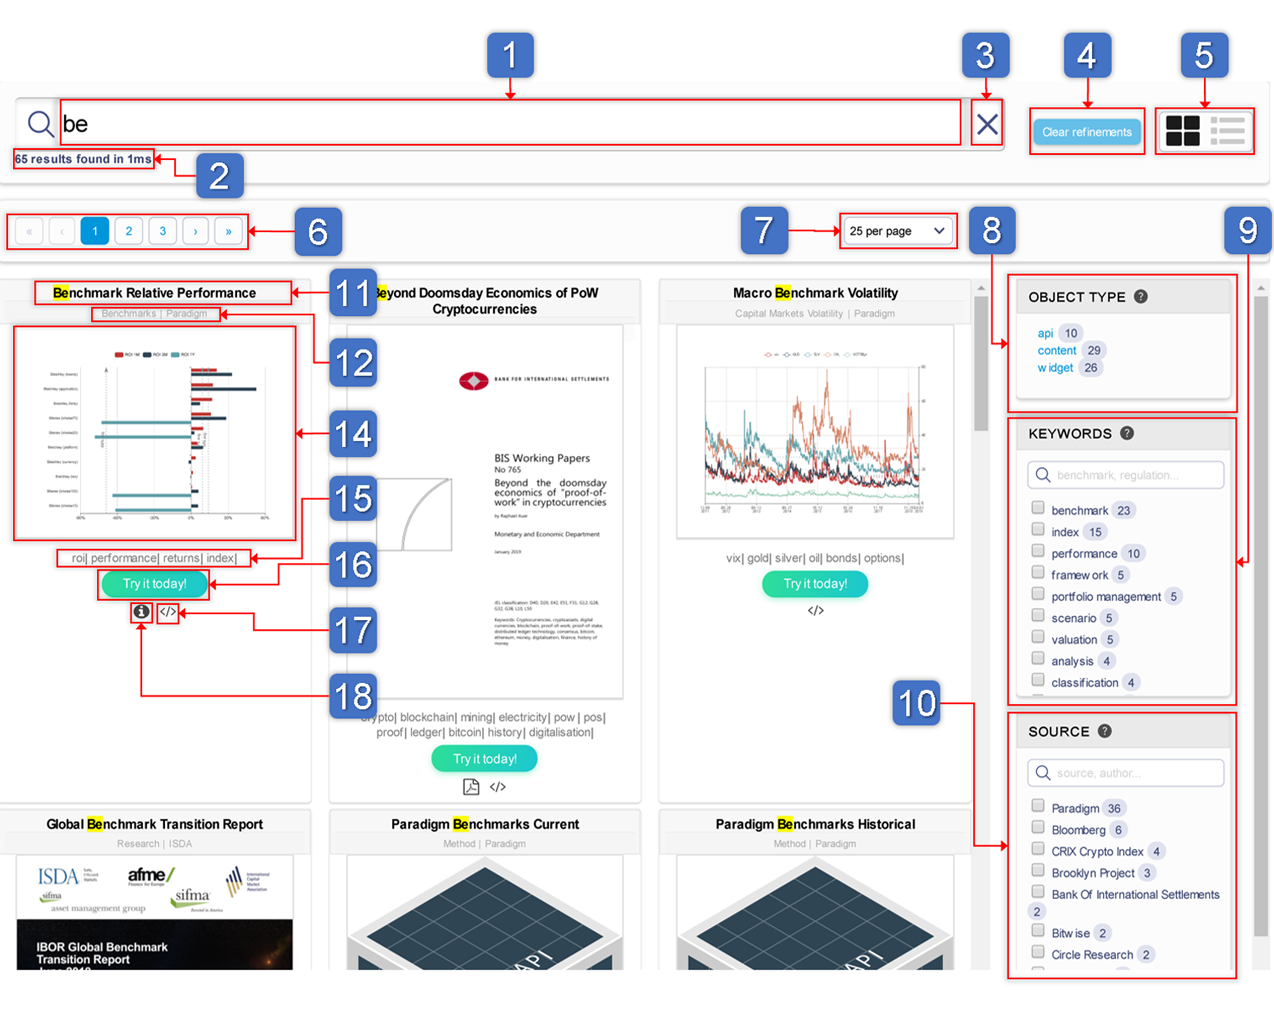
API Explorer
Purpose: Use the API explorer to search for API data, endpoints, charts, research and content simultaneously.
Overview: The explorer was designed to be a simple yet powerful tool for quickly accessing themes, keywords, datasets and research content across hundreds of different representations and sources at the same time. It can be exhausting searching multiple times from scratch for effectively the same thing using some of the more conventional websites and providers. We aimed to solve some of that with the explorer.
Features:
- Search instantly by typing, filtering, clicking, scrolling or just browse
- Toggle individual keywords, sources and object type filters in real time
- Search for only particular data object types (ie API endpoint) or specific sub categories
- Find important details including tags, keywords and related objects without having to leave the page
- Launch your API endpoint, data cluster, chart widget or research content directly from the explorer results
Explorer Control Surface
- Search
- Results returned
- Clear
- Clear Filters
- Toggle View
- Page view
- Results per page
- Filter: Object Type
- Filter: Keywords
- Filter: Source
- Title
- (Subcategory) | Source
- Subcategory | (Source)
- Object
- Keywords
- Direct URL
- API docs URL
- Status URL
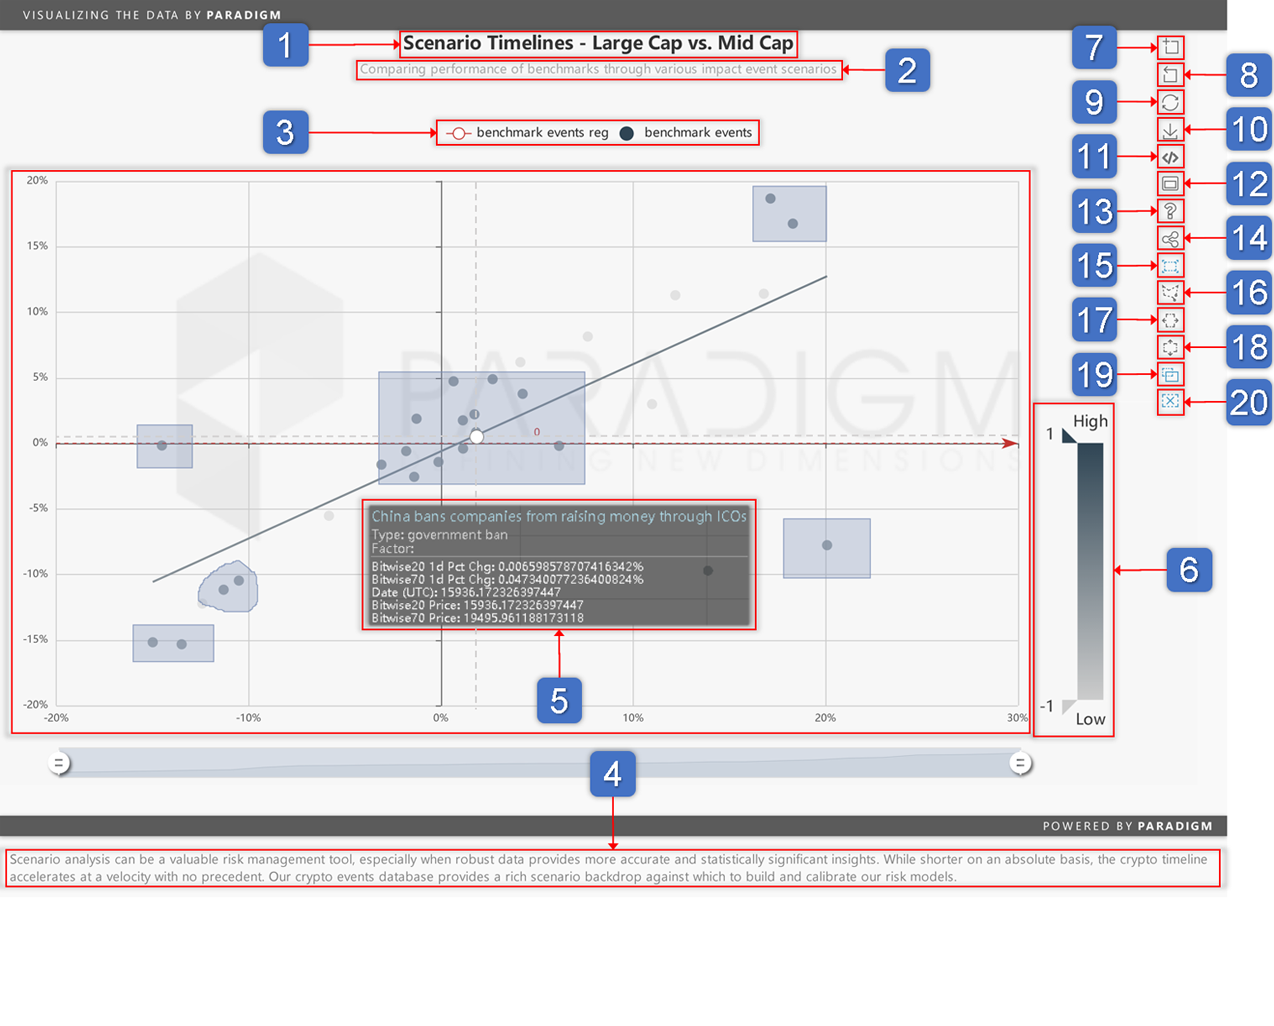
Charting Engine
Purpose: Visualizing crypto data presents a variety of novel challenges. From collection to extraction, scrubbing and charting there are places to make mistakes you couldn’t imagine. Our custom charting engine was built to solve that.
Overview: After testing over 25+ charting libraries, engines and services we decided to build our own. Being built from the ground up along with our entire data stack means we’re able to chart any of our data. Certain data object types have been pre-optimized allowing us to generate custom charts for tens of thousands of unique crypto assets and millions of mashup combinations on the fly. This capability allows us to extract and present insights with maxium flexibility.
Features:
- Embeddable on any external site, app or similiar
- Natively scalable with multiple sizing options
- Native support for rendering in full html/js, .JPG, .PNG, .SVG and canvas
- 50+ chart types (sankey, regression, multi, node, heatmap etc)
- Custom built charting components & elements
- White labeling available for custom/enterprise accounts*, please contact us
Charting Control Surface
- Title
- Subtitle
- Data series
- Description
- Chart details
- Axis control
- Select
- Select reset
- Refresh
- Download image
- See API code
- See larger size
- Report issues
- Share
- Select specific
- Select freeform
- Select X axis
- Select Y axis
- Select multiple
- Remove selections
Tutorials
If you’ve already familiarized yourself with our guides (listed above) and are ready for more, please try some of our tutorials & learning modules.
Here you can find sample templates and code examples written in different languages to help you quickly get started.
- Excel tutorials
- Google Sheets tutorials
- CryptoSheets tutorials
- Plot.ly tutorials
- Power BI tutorials
- Python tutorials
Take our quick tutorials on how to more effectively use the Paradigm explorer, console and charting engine. Additional and more advanced scenario learning modules are available upon request. Also check our quick guides here for recent updates.
- API Explorer tutorials (coming soon*)
- API Console tutorials (coming soon*)
- Charting Engine tutorials (coming soon*)
© ParadigmAPI.com 2019-20 | All Rights Reserved | info@paradigmapi.com.