Charting Engine
The Paradigm API charting engine can visualize any data that we serve through our API. It was designed to handle complex data structures, object models and visualization types. Users can also access the specific data behind any given chart or widget that is publicly deployed directly through the API or in CryptoSheets (both Excel add-in and GoogleSheets version).
Quick Links:
Search
Quickly search all of our public charts using the API Explorer
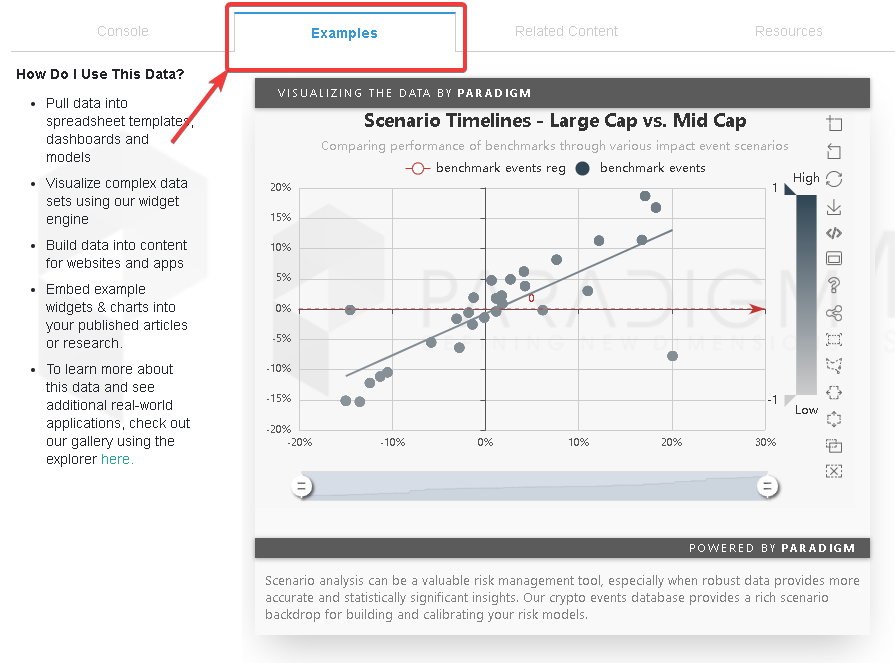
Endpoints
Find relevant charts for each endpoint (using the data from that endpoint) in the console examples tab
Guide
Use the widget quick guide as a reference for using charts and widgets
Chart Data
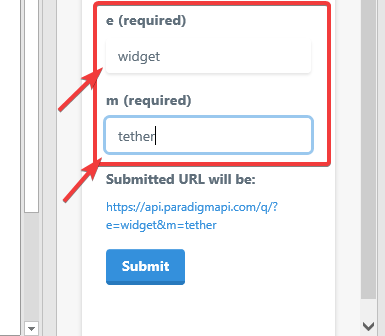
For users with access, call the data for any chart or widget directly by using the uniconsole /q? endpoint
Example API call: https://api.paradigmapi.com/q/?subscription-key=[APIKEY]&e=widget&m=tether API console: https://docs.paradigmapi.com/widgets/console?endpoint=q
For users with CryptoSheets.com accounts (basic accounts are free*) you can pull chart data directly into your spreadsheet using the /q? endpoint at the bottom of the API in the add-in side panel
Widgets
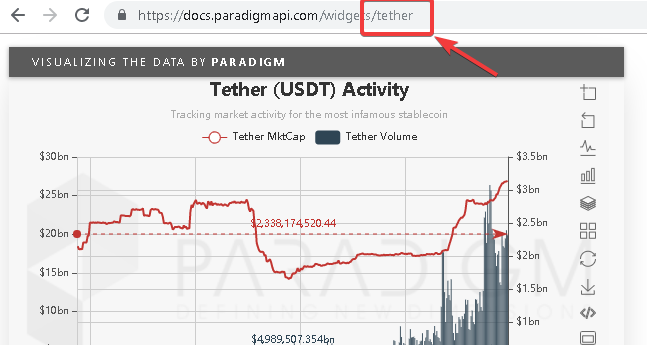
All Paradigm charts and widgets can be embedded in external web pages, apps, news articles, research and more using simple iframes.
<iframe src="https://docs.paradigmapi.com/widgets/tether"></iframe>
<iframe src="https://docs.paradigmapi.com/widgets/tether?size=small"></iframe>
<iframe src="https://docs.paradigmapi.com/widgets/tether?size=medium"></iframe>
<iframe src="https://docs.paradigmapi.com/widgets/tether?size=large"></iframe>
<iframe src="https://docs.paradigmapi.com/widgets/tether?size=xlarge"></iframe>
Simple attribution is required for free accounts.
Custom
White-labeling for any chart, type or style including custom data is available on demand, please contact us directly.
© ParadigmAPI.com 2019-20 | All Rights Reserved | info@paradigmapi.com.